Today, NFER has published a new, interactive teacher recruitment and retention data dashboard.
We have been working on the tool since 2020 as part of a programme of research on teacher supply, funded by the Nuffield Foundation.
The dashboard provides information on teacher recruitment and retention challenges in England and their implications for pupils and schools in terms of teacher shortages across different dimensions, including geography, subject and school types. The aim of the dashboard is to increase understanding of the nature of the teacher supply challenge, inform stakeholders by highlighting specific challenges, and support policymakers and decision-makers to take action to address teacher shortages in the areas where they are most prevalent.
In this blog, I explore three key things we have learnt from the School Workforce Census data analysis that underpins the dashboard:
- Schools with high levels of disadvantage find it more challenging to retain teachers and show more signs of experiencing teacher shortages
The dashboard data shows that schools with higher levels of pupil disadvantage have higher teacher attrition (leaving) and turnover rates compared to other schools. The data also shows that schools with higher levels of disadvantage spend more per pupil on supply teachers and have more unfilled vacancies and temporarily-filled posts. It also shows they are more likely to have maths lessons taught by teachers without maths undergraduate degrees (excluding teaching degrees such as PGCE/ BEd) and science lessons taught by teachers without science undergraduate degrees.
This suggests that schools with higher levels of disadvantage tend to find recruiting teachers more challenging and have to take more actions to mitigate the impact of teacher shortages.
Deploying non-specialists to teach a subject is likely to have negative implications for the quality of the pupils’ learning in the classroom, as having deep and fluent knowledge and flexible understanding of the content you are teaching is an important element of effective teaching.
The difficulties that schools with higher levels of disadvantage face in recruiting and retaining teachers are likely to be impacting on pupils’ education and learning, and contributing at least in part to the gap in educational outcomes between pupils from disadvantaged backgrounds and their more affluent peers.
Therefore, solutions to the national teacher supply challenge have important links to the challenges of levelling up educational outcomes, increasing social mobility and closing the disadvantage gap.
Teacher retention and turnover rates, and indicators of teacher shortages, are higher in secondary schools with the highest rates of pupils eligible for free school meals
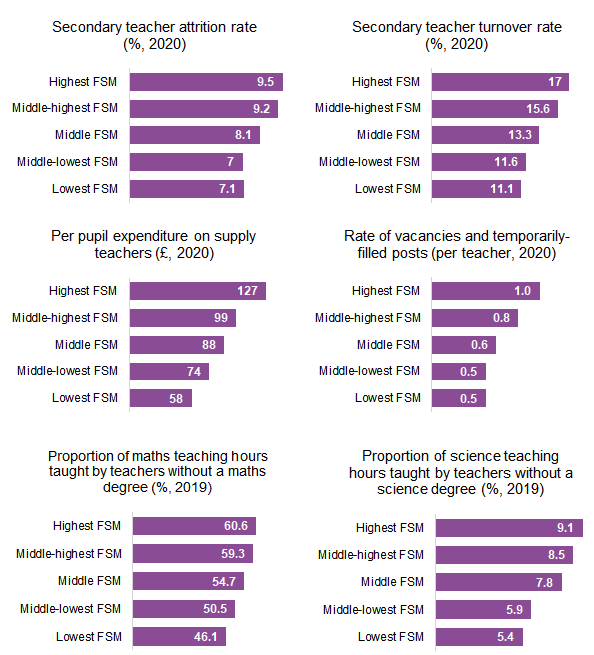
Note: The proportion of teaching hours taught by teachers without an undergraduate degree excludes teaching degrees, such as PGCE/ BEd. This means, particularly for maths where a teacher may have a quantitative degree (e.g. economics, science, engineering) and therefore an appropriate level of subject specialism, that it may understate the amount of subject specialism. Nonetheless, the gradient by level of FSM is the important point.
- 2. The Government’s Education Investment Areas (EIAs) appear to have very similar workforce challenges to non-EIAs
The data shows that there is very little discernible difference in teacher retention and shortage measures between schools within Education Investment Areas, compared with other areas. Announced as part of the Government’s February 2022 Levelling Up White Paper, EIAs are areas where ‘educational outcomes are currently weakest’, as well as ‘other local authorities containing existing place-based interventions’.
A key policy measure targeted at these areas is the ‘levelling up premium’: early-career payments early-career teachers in the shortage subjects of chemistry, computing, mathematics and physics. But the recruitment and retention data raises questions about whether this policy is targeting an issue that these schools particularly face.
For example, the rate of secondary early-career teachers (within their first five years since qualifying) leaving the state sector in 2020 was 11.5 per cent in EIAs, compared to 12.3 per cent in non-EIAs.
Further, it isn’t clear that schools in EIAs face greater challenges recruiting and retaining teachers in shortage subjects than in other areas. The proportion of science teaching hours in 2019 taught by teachers without a science degree was 7.2 per cent in both types of area.
Vacancies and temporarily-filled posts, expenditure on supply teachers and subject specialist coverage in other subjects are also very similar between the two types of area. Evidence suggests that early-career payments in shortage subjects have been effective at improving retention.
We have called for the policy to be applied nationwide, rather than targeted at EIAs, in order to further boost retention in these subjects.
However, another reason for expanding the programme would be that the issue it is targeting is one common to all schools, not schools in EIAs specifically.
- 3. Identifying geographical teacher recruitment and retention ‘cold spots’ is challenging
The data dashboard presents a wealth of information about retention and potential shortages by geographical area, presenting data by local authority areas, labour market areas (ONS travel to work areas (TTWA) and parliamentary constituencies. However, the different measures combined do not paint a clear picture of where potential geographical ‘cold spots’ can be found.
For example, the Blackpool TTWA had a high proportion of secondary science lessons taught by teachers without a science degree in 2019, as did Hastings, Bude, Isle of Wight and Barrow-in-Furness.
However, the rate of secondary teachers leaving the state-funded sector in 2020 was below average for Blackpool, Bude, Isle of Wight and Barrow-in-Furness. While the teacher attrition rate was higher than average in Hastings, the proportion of maths lessons taught by a teacher with a maths degree in 2019 was around average.
This picture chimes with the findings from the statistical analysis of teacher supply challenges by the Department for Education in 2017, which concluded that ‘we can see no strong geographic trends in teacher supply issues, showing that it is a school level issue.’
One area that was consistently different in its teacher retention and shortage metrics is London. We have previously highlighted the particular challenges of the London teacher labour market, and our data dashboard confirms that this picture continued into 2020. The London TTWA has a higher attrition rate, turnover rate, vacancy rate and expenditure per pupil on supply teaching than the national average. However, the proportion of maths and science teaching hours taught by specialists is similar to the national average.
Overall, the data suggests that the geographical picture on teacher supply and shortages is complex, but providing long-term, well-targeted and adequately funded support to schools in disadvantaged areas is necessary to adequately address teacher workforce gaps, and ultimately pupil attainment gaps.
The data dashboard can be accessed and explored here. We hope to be able to update and develop the dashboard further in the future, so please send any feedback.
Register for free
No Credit Card required
- Register for free
- Free TeachingTimes Report every month